
Shopping shifts: perspectives on retail properties in the current context
Q3 2021 When we founded Chestnut Funds in 2012, our investment thesis was that opportunity existed in the middle market space to manage funds in an institutional manner but with a focus on assets that typically did not attract institutional capital. We focused on property types that we had first-hand experience with - office, retail, industrial, and medical outpatient properties. During 2021, our Viewpoints series will discuss the property types that we invest in, outline some of the reasons we make these investments, and share our view of what the future might hold.
The COVID-19 pandemic accelerated many trends over the last 18 months. A trend that we closely monitored is the continued shift toward e-commerce in the retail sector. We are frequently asked about our take on investing in retail properties in light of the many ongoing challenges. So, as a third installment for the 2021 Viewpoints series outlining our views on different property types in which we invest, we are focusing on the retail sector, the challenges it faces, opportunities that may exist, and how Chestnut’s current investment strategy is informed by these factors.
The Shifting Retail Landscape
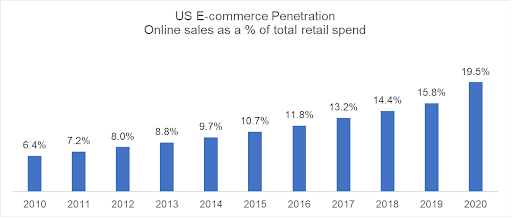
According to Digital Commerce 360, US consumers spent over $860 billion online with retail merchants in 2020, an increase of over 44% from 2019. Prior year increases were closer to 15% annually. And while total retail sales increased from 2019 to 2020, retail sales from brick-and-mortar stores were actually down in 2020 when compared to 2019, marking the first time in history that e-commerce sales accounted for all of the retail sector’s growth.

Source: Digital Commerce 360, US Department of Commerce data
In our opinion, the explosive annual growth of e-commerce is unlikely to be replicated in future years. But sales estimates for 2021 indicate that e-commerce will again grow as an overall portion of retail sales. In 2020, according to Digital Commerce 360, online sales accounted for 19.5% of all retail sales.
Source: Digital Commerce 360, US Department of Commerce data
According to Retail Dive, a majority of online sales still come from traditional brick-and-mortar retailers, meaning a traditional retailer that is also offering products for sale online. While true that Amazon accounted for almost a third of online sales in 2020, that share is lower than in 2019 as other retailers expanded their e-commerce presence in response to the pandemic, correlating with an increased share of online sales.
The increase in e-commerce sales was in concert with a steep decline in foot traffic at stores. The early days of the pandemic saw almost a 50% decline in in-store traffic. Even in the last quarter of 2020, when pandemic mitigation measures were often in place in retail settings, foot traffic averaged 15% lower than the same period for prior year.
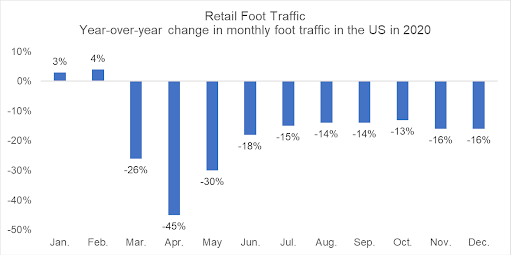
Source: Sumida/Retail Dive
Increased e-commerce sales were driven by several categories. Foremost among them was home furnishings and home improvement sales, which is conventionally believed to have increased because people were spending so much time in their homes due to pandemic concerns. According to Retail Dive, the hardest hit retail categories included clothing and accessories, categories that saw an almost 30% decline from January to October 2020.
The Impact on Retail Properties
Decreased foot traffic, flat year-over-year sales, a continuing pandemic, and increasing e-commerce competition all conspire to negatively impact retail property performance. And while the retail property sector is diverse, made up of many differing types of properties and tenants that have been disparately impacted, there were 52 bankruptcies for major retailers in 2020 according to S&P Global Market Intelligence. This is 63% higher than in 2019 and the highest amount in the last decade. In addition to bankruptcies, store closings exceeded new store openings for the 4th consecutive year, and the trend is expected to continue.
Bankruptcies and store closings result in excess space, putting pressure on rental rates and driving down property income. The counterweight to this trend, we believe, is the significant amount of retail space that is expected to be converted to other uses. One notable projection from CBRE is that the total amount of US retail inventory will decrease by up to 20% by 2025. This reduction in space is anticipated to be primarily adaptive reuse and conversion of obsolete properties, driven by owners of class B and C malls.
Investing in Retail Properties
According to Nareit, the retail sector continues to comprise a very large portion of the overall commercial real estate market, making up approximately 25% of commercial real estate square footage. From our perspective, the diverse property types within the retail sector were impacted very differently by e-commerce trends and shifts in consumer buying behavior in response to the pandemic. That said, we expect institutional investment in the retail sector to continue to decline as a portion of overall allocation to commercial real estate, putting pressure on valuations, particularly for large assets.
Property Types
The challenges for malls are well-known throughout the commercial real estate industry and pre-date the pandemic. In our opinion, the retail properties that have shown the most resilience, both in terms of leasing and valuation, are single-tenant net lease properties, grocery-anchored shopping centers, and neighborhood shopping centers with tenants that focus on providing services. This latter group would include restaurants, though these businesses have clearly had challenges during the pandemic. Our view is that these three property types continue to have debt financing and equity capital readily available, and the products sold are often less replicable or impossible to deliver through an e-commerce platform.
Markets
In our opinion, markets that appear to be well-positioned in the near term include Sun Belt cities that are experiencing fast population growth. Cities and towns that are seeing an influx of remote workers from major cities are also likely to benefit, and in major markets, we expect the suburbs to outperform the urban core.
We have observed that urban markets have seen the most decline in occupancy during the pandemic as mitigation restrictions tend to be greater, and the office workers that support much of urban retail continue to work from home. This lack of traffic has negatively impacted leasing at urban retail properties.
Investment Opportunities
Our view is that some retail properties will continue to present an attractive investment opportunity. We have observed that cap rates on retail assets are almost 200 to 300 bps higher currently than some of the more “in vogue” property types such as industrial, multi-family, self-storage, and medical outpatient. We anticipate that at some point, these higher initial yields may become attractive so long as an investor is mindful of risk and focused on attractive property types and markets.
While institutional investors may pull back from larger assets, our view is that lower pricing could spur opportunistic investors to step in to acquire and potentially rehabilitate or redevelop assets. This would have the positive effect of perhaps converting space to other uses, such as industrial, multifamily, office, or hotel, decreasing the overall retail inventory. Furthermore, retailers may be spurred to innovate and come up with new retail concepts that create in-person sales and traffic while creating opportunities for supportive e-commerce sales.
We have focused our retail investment efforts over the last several years on grocery-anchored developments, service-oriented neighborhood shopping centers, and single-tenant net-lease properties. Each of these property types has held up reasonably well during the pandemic. And while we are cautious regarding new retail investments, we have been pleasantly surprised by the amount of retail leasing activity that we have seen in our investment portfolio, particularly with single-tenant net-lease tenants, grocers, and fast-casual restaurants. Furthermore, in 2020 and 2021 to date, we have experienced reasonable buyer appetite for retail assets when we have taken properties to market.
Our experience is in line with the broader market. In Q2 2021, according to CBRE, all retail categories achieved year-over-year growth. This is a function of both the low sales of 2020 as well as the improving economy and strong demand. Improving sales have spurred retailers to expand their square footage as evidenced by positive net absorption to date in 2021.
Recent Chestnut Retail Investment
In keeping with our view that opportunity exists for selective and careful investments in retail properties, Chestnut made several retail investments in the last couple of years. An example below, which pre-dates the pandemic, is reflective of retail investment opportunities Chestnut will continue to pursue.
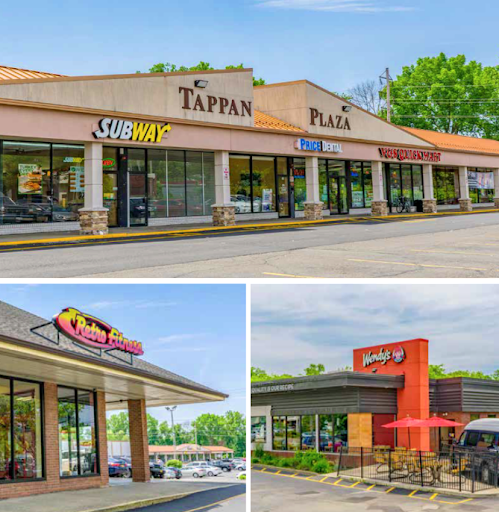
Tappan Plaza
A 2019 investment in Tappan, NY with Benbrooke Realty Investment Company, Tappan Plaza was acquired on an opportunistic basis with an investment strategy that included monetizing two single-tenant, net-leased outparcels and a redevelopment plan for a vacant 20,000 square foot anchor space. Building on the demand for grocery, the vacant space was marketed to several grocers, and Lidl, an aggressively expanding Germany-based grocer, elected to acquire a portion of the center that included the vacant space to develop a new store.
This investment squares with our investment strategy for retail by focusing on a neighborhood shopping center located in a superior suburban location outside New York City. The expected single-tenant sales will serve to reduce the investment basis such that the remaining space can renovated and leased at very competitive rents while providing an attractive on-going return.
Conclusion
US retail has faced significant headwinds and absorbed several heavy blows over the last few decades. Nonetheless, retail activity continues with consumers continuing to shop and retailers continuing to adapt, innovate, and expand. Given Chestnut’s relationships in the sector and opportunistic view toward new investment, we will continue to seek opportunities in keeping with our view of the market.
Sources
Ali, F. (2021, February 19). Charts: How the Coronavirus is Changing Ecommerce. Digital Commerce 360. https://www.digitalcommerce360.com/2021/02/19/ecommerce-during-coronavirus-pandemic-in-charts/
CBRE. (2021). US Retail Figures Q2 2021. https://www.cbre.us/research-and-reports/US-Retail-Figures-Q2-2021
CBRE. (2021). 2021 US Real Estate Market Outlook, Retail. https://www.cbre.us/research-and-reports/2021-US-Real-Estate-Market-Outlook-Retail
Salpini, C. (2021, January 19). What 6 Charts Say About the Pandemic's Impact on Retail. Retail Dive.https://www.retaildive.com/news/what-6-charts-say-about-the-pandemics-impact-on-retail/593102/
Yohn, D. (2020, July 6). The Pandemic Is Rewriting the Rules of Retail. Harvard Business Review. https://hbr.org/2020/07/the-pandemic-is-rewriting-the-rules-of-retail
Young, J. (2021, February 19). A Decade in Review: Ecommerce Sales vs. Total Retail Sales 2011‑2020. Digital Commerce 360. https://www.digitalcommerce360.com/article/e-commerce-sales-retail-sales-ten-year-review/
The information contained in this newsletter is intended for informational purposes only and is not intended to provide personalized investment advice or to constitute an offer or solicitation to buy or sell securities or interests in any investment. The charts, graphs, and other information contained herein should not serve as the sole determining factor for making investment decisions.
This newsletter cannot be reproduced, shared, or published in any manner without the prior written consent of Chestnut Funds (“Chestnut”). Unless otherwise indicated, all statements and expressions in this paper are the sole opinion of Chestnut and are subject to change without notice. Predictions, forecasts, or outlooks described or implied are forward-looking statements based on certain assumptions, which may prove to be wrong, and/or other events, which were not taken into account, may occur. Any predictions, forecasts, outlooks, opinions, or assumptions should not be construed to be indicative of actual events, which will occur. The opinions and data in this newsletter have been obtained from sources believed to be reliable. Chestnut does not warrant the accuracy or completeness of such and accepts no liability for any direct or consequential losses arising from its use.
Investing in securities involves risk of loss and should not be based solely on marketing materials including the information provided herein. Further, depending on the different types of investments there are varying degrees of risk. Private Funds managed by Chestnut and their investors should be prepared to bear investment loss, including loss of original investment. There is no assurance that any specific investment or investment strategy utilized by Chestnut will be either suitable or profitable for your portfolio. Chestnut does not provide personalized or customized investment advice, therefore you are urged to discuss your personal investment situation with the financial professional of your choice before making or changing an investment in a Chestnut offering.
Because of the inherent risk of loss associated with investing in any type of securities, Chestnut is unable to represent, guarantee, or even imply that its services and methods of analysis can or will predict future results, successfully identify market tops or bottoms, or insulate you from losses due to market corrections or declines.