
Examining the MOB Sector in Light of the Broader CRE Environment
By Steen Watson, CEO, Chestnut Funds
Q1 2024 Chestnut Funds focuses its investment activities on medical outpatient buildings (MOBs) throughout the US. As a result, we closely monitor the market for MOBs and the impacts of federal rate changes, financing rates, terms, and availability, and the broader economic environment on the sector. Because MOBs are a sector within the larger commercial real estate (CRE) market, they are impacted, both positively and negatively, by changes in the overall CRE market. Nonetheless, we believe that MOBs and the MOB market have unique characteristics that position them to be an attractive and growing investment opportunity.
In this installment of Viewpoints, we will discuss and analyze current market conditions and their impact on the MOB sector. Additionally, and in light of those conditions, we will discuss the structural demand drivers that we believe support MOB investment.
Capital Markets
The rise in the federal funds rate from nearly 0% in late 2021 to 5.33% has significantly increased borrowing costs. High financing costs have in turn led to higher cap rates and lower valuations. Because of lower valuations, many sellers have chosen to not sell properties. This slowdown in transaction volume is seen most clearly in the lower transaction volume for stabilized assets where owners are under little pressure to sell assets that are performing well. In addition to higher rates, tighter lending standards and general market concerns have contributed to slowing MOB investment activity, which in 2023 was reduced to a level not seen for over a decade.


Transaction data across all property types points to valuations being down approximately 20% or more. Recent cap rate data supports this estimate. While cap rates differ for different property types, the most recent transaction data suggests that the average cap rate for MOBs as of the end of 2023 is about 6.9% This cap rate level is approximately 75 to 100 basis points higher than seen at the market peak. It is important to note, though, that many core transactions in high-quality locations are happening at cap rates lower than the average. It is our view that due to the lower transaction volume for core assets, which have historically comprised most of the MOB transaction volume, the cap rate average is skewed higher by transactions taking place for lower occupancy and/or value-add properties.

Source: Green Street; Revista
While MOB cap rates have increased, market data suggests that cap rates for other property types have increased at a greater rate. This suggests to us that MOBs remain, on a relative basis, an attractive investment alternative due to strong operational performance and structural demand drivers that support the need for healthcare services.
On March 20th, Federal Reserve Chair Jerome Powell projected Federal funds rate reductions in 2024. If this were to happen, our view is that it would be positive for CRE to the extent that lending rates decreased as well. In both rate tightening and loosening cycles, we have observed that cap rates tend to respond more slowly than financing costs. As a result, we would expect cap
rates to remain at or close to current levels for some time
even if financing costs decrease.
MOBs: A Small but Growing Sector
MOBs represent a small segment of the overall CRE market. And while the MOB market has unique characteristics that differentiate it from other property types, it is not immune from the challenges faced by the broader market. But as the demand for outpatient healthcare services continues to grow, our expectation is that the MOB sector will grow as well, creating opportunities for investment. Furthermore, as the MOB sector continues to attract new investors and capital, the possibility for MOB cap rates to benefit is enhanced as new entrants to the market compete for investment opportunities in the relatively small but growing sector.
An analysis of the top 50 US markets shows that the total square footage of MOBs is approximately 14% of the square footage of traditional office buildings. While MOBs are similar in many respects to traditional office buildings, not all office buildings can be MOBs because building configuration, location, mechanical systems, and size may not be suitable for the optimal delivery of healthcare services. In any event, this supply comparison highlights the niche nature of MOBs.


Furthermore, MOB transactions represent a very small percentage of overall CRE transaction volume. MOB sales have varied from between 1% and 4% of CRE sales since 2016, a reasonable proxy for the amount of MOB inventory relative to the total CRE market. And when looping in MOB with other so-called alternative or niche CRE sectors, such as data center, self-storage, life sciences, and student housing to name a few, MOB transaction volume comprises approximately 20% of alternative property sector transaction volume. Taken together and considering that healthcare spending is approaching 17% of GDP, our view is that the sector stands to grow significantly to meet the demand for healthcare services.

Structural Demand Drivers Support MOB Investment
The demand for MOBs derives from the demand for healthcare services and the changing ways in which those services are being delivered. Because of these demand drivers, in our experience MOBs tend to exhibit consistent occupancy levels and income growth, desirable characteristics for many investors.
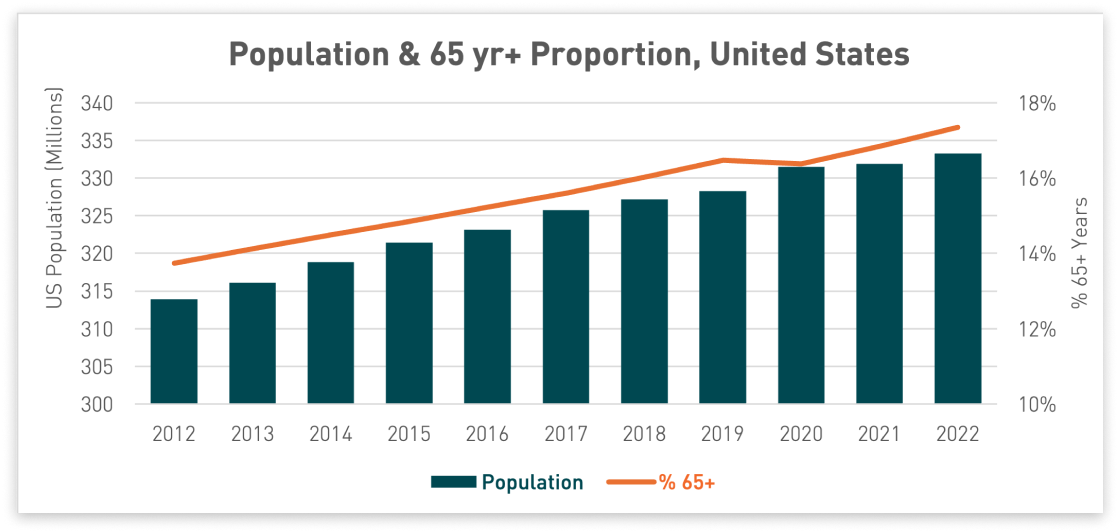
Growing and Aging Population
As the US population grows, the demand for healthcare services increases in parallel. In addition to an increasing population, the percentage of the US population that is older than 65 continues to increase, further bolstering demand for healthcare services.
As individuals age, health care spending increases. Individuals in the United States older than 65 spend significantly more on healthcare services.
The combination of a growing and aging population increases the demand for healthcare services and also increases the demand for MOBs as healthcare providers seek to provide care in a cost-effective, patient friendly environment.

The Shift to Outpatient Care
Hospitals and other healthcare providers continue to shift many services to an outpatient setting to increase convenience and provide lower cost care. Outpatient visits have rapidly outpaced inpatient admissions to hospitals, evidence of this shift. Outpatient care is enhanced by healthcare service providers locating in facilities that are designed for specialized purposes.
Source: Kaiser Family Foundation
Increasing Specialization
Since 1980, the proportion of patient visits to specialty physicians has consistently grown, with 50% of all physician visits made to specialty care providers in 2019 versus only 34% in 1980. Specialty care physicians often seek purpose-built medical outpatient buildings and other healthcare real estate that provide the custom, state-of-the-art facilities necessary to deliver their services and meet patient expectations.
Source: National Center for Health Statistics; National Ambulatory Medical Care Survey
Opportunities in 2024 & Beyond
Encouraged by the MOB sector's positive demand drivers and what we believe are glimpses of improving broader economic indicators on the horizon, we remain committed to our strategy of MOB investing across the risk/return spectrum. In 2024, it is our view that value-add, development, and opportunistic MOB investments may present the best risk-adjusted opportunities. Into 2025 or when financing rates begin to decline, we believe that core plus MOBs may also be favorable opportunities.
At Chestnut, we navigate times of market change and uncertainty by focusing intently on the basics: closely manage existing investments to maximize value and seek out quality investment opportunities amidst the noise by sifting through countless opportunities and exploring new partnerships.
Sources
Board of Governors of the Federal Reserve System. Federal Funds Effective Rate. (March 1, 2024)
Globe Street. Berger, Richard. MOB Cap Rates Rise for Fifth Consecutive Quarter. (March 12, 2024)
Green Street. Commercial Property Price Index. (March 6, 2024)
Green Street. Property Insights: How Low do Appraised Values Need to Go? (February 6, 2024)
Green Street. CRE Transaction Data. (Accessed March 2024)
H2C Securities Inc. H2C Medical Outpatient Building 4Q 2023 Quarterly Update: Decade-Low Transaction Volume of $8.3B in 2023. (February 2024)
Kaiser Family Foundation. Hospital Outpatient Visits per 1,000 Population by Ownership Type; Hospital Admissions per 1,000 Population by Ownership Type. Report data source: 1999 - 2021 American Hospital Association Annual Survey.
National Ambulatory Medical Care Survey: 2019 National Summary Tables. Santo L, Kang K.
National Center for Health Statistics. Health, United States, 1980 - 2015: Table 77. Hyattsville, MD. 2017.
Peterson-KFF Health System Tracker. Amin, Krutika, Cox, Cynthia, McGough, Matthew, Rakshit, Shameek, & Wager, Emma. How does Health Spending in the U.S. Compare to Other Countries? (January 23, 2024)
Revista. MOB Transaction Data. (Accessed March 2024)
Revista. MarketViewTM Metro Report – Top 100. (4Q 2023; 1Q 2024)
US Federal Reserve. Transcript of Chair Powell’s Press Conference. (March 20, 2024)
US Bureau of Labor Statistics, Consumer Expenditure Surveys, 2021.
US Census Bureau. Population Estimates Program. (Accessed March 2024)
The information contained in this newsletter is intended for informational purposes only and is not intended to provide personalized investment advice or to constitute an offer or solicitation to buy or sell securities or interests in any investment. The charts, graphs, and other information contained herein should not serve as the sole determining factor for making investment decisions.
This newsletter cannot be reproduced, shared, or published in any manner without the prior written consent of Chestnut Funds (“Chestnut”). Unless otherwise indicated, all statements and expressions in this paper are the sole opinion of Chestnut and are subject to change without notice. Predictions, forecasts, or outlooks described or implied are forward-looking statements based on certain assumptions, which may prove to be wrong, and/or other events, which were not taken into account, may occur. Any predictions, forecasts, outlooks, opinions, or assumptions should not be construed to be indicative of actual events, which will occur. The opinions and data in this newsletter have been obtained from sources believed to be reliable. Chestnut does not warrant the accuracy or completeness of such and accepts no liability for any direct or consequential losses arising from its use.
Investing in securities involves risk of loss and should not be based solely on marketing materials including the information provided herein. Further, depending on the different types of investments there are varying degrees of risk. Private Funds managed by Chestnut and their investors should be prepared to bear investment loss, including loss of original investment. There is no assurance that any specific investment or investment strategy utilized by Chestnut will be either suitable or profitable for your portfolio. Chestnut does not provide personalized or customized investment advice, therefore you are urged to discuss your personal investment situation with the financial professional of your choice before making or changing an investment in a Chestnut offering.
Because of the inherent risk of loss associated with investing in any type of securities, Chestnut is unable to represent, guarantee, or even imply that its services and methods of analysis can or will predict future results, successfully identify market tops or bottoms, or insulate you from losses due to market corrections or declines.